
|
Over the years, several archaeological studies have focused on ceramic figurines, whistles, and other clay artifacts. Some of these artifacts are clearly modeled and others were elaborated using molds. Although molds are still scarcely found in the archaeological record, evidence gathered to date suggests a level of standardization might have existed wherein modifications to a basic theme were accomplished by individual makers.
One formidable question encountered by researchers involves the relationship of figurine to mold and whether standardized or mass production could be demonstrated through traditional ceramic analysis. To demonstrate standardization and production, a connection must be established between mold and its positive figurine or whistle or stamp and its recurring impression on vessel surfaces or sherds. Clearly, the smaller the amount of deviation noted from mold to figurine or among similar objects the more likely the artifacts under study share a common origin and thus represent standardization and mass-production.
Using a laser 3D line scanner, we have collected a sample of ceramic molds, figurines, whistles, and stamps from Honduras, Mexico, and Belize. In addition, stamped vessel fragments recovered from sites in the southeast United States were scanned.
The goals of this project are:
1. To test the use of 3D scanning technology in the assessment of mold and stamp use as a methods of standardized mass production of clay artifacts in prehistoric Mesoamerica and beyond.
2. To digitally archive images from artifacts in various collections and make it accessible to researchers and the public in general.
3. To create a virtual catalogue of clay artifacts that contains RAW data useful for further archaeological metrology analysis to researchers around the world.
The method we developed for small object 3D metrology involves a series of steps to capture the entire geometry of object surfaces with a high-degree of accuracy and determine goodness of fit. An initial visual examination is performed to determine if any distinctive surface characteristics which could produce less than desirable scan results, and a best orientation for scanning. Concave and convex surfaces must be oriented to produce optimal surface readings. Glass, smooth stone surfaces (in particular obsidian, a form of natural glass), black or dark specimens, as well as glossy metallic, transparent or translucent artifacts all negatively impact laser performance. Decorated surfaces whether painted, incised, or stamped will produce varied results. Moreover painted on designs require texture analysis. Surface designs on ceramic artifacts can be analyzed using methods developed to characterize land use or land coverage using data collected by satellite-borne sensors. We noted several artifacts having painted decorative designs will produce a slightly etched surface in 3D which can be helpful in comparative analyses. In those cases our method has the potential to produce accurate comparisons provided the etching is deep enough to survive several iterations of the surface deviation analysis. Using our methods, we have also identified presumably impressions which represent maker’s fingerprints on several ceramic artifacts.
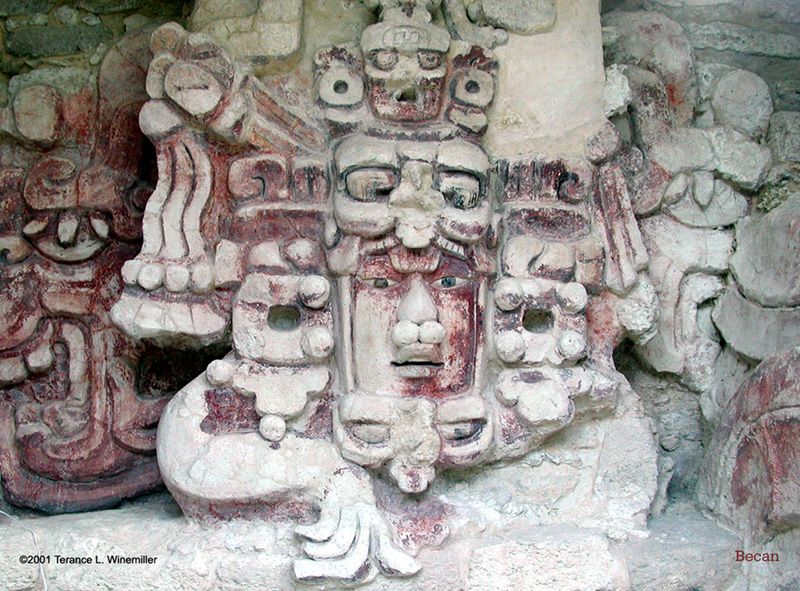
During the scanning process, the object is rotated seven times while seven facets are measured. In addition a high resolution photo of the object is captured for each facet. For optimum results, scanning is accomplished in high definition mode which produces a point density of approximately 400 loci per cubic inch under ideal conditions. This method yields a very detailed three-dimensional surface. Any sized object can be scanned using HD technology; however, large objects produce extremely large data files such as this carved stone containing hieroglyphic writing which is part of a large monument.This size limitation has not presented us with any insurmountable problems so far. Processing raw point cloud data requires several steps.
The scanning process takes approximately 45 to 50 minutes to complete facet scans. After scanning, the facets are automatically joined using an auto correlation algorithm to match mesh vertices. Based on user defined parameters of precision, the iterative algorithm will discard individual points that are outside useful tolerances in building the STL model. Photographs taken during the scanning operation are layered on the wire mesh model as texture. The scanner also captures a portion of the specimen platform which must be removed from the file manually before exporting the object in a format which can be ingested by two different software applications. We processed and accomplished analyses in Rapidform’s Rapid Works 3.03 which is designed exclusively for the Next Engine HD scanner and Hexagon’s PcDmis Reshaper 8.3.4. The Hexagon product is designed for and used widely in the aircraft and automobile engine part manufacturing industry to test for goodness of fit and part wear, thus has a much higher level of precision capability than our application requires. In all cases, triangulated mesh models must be developed from point clouds prior to analysis.
The multiple facets generated during the scanning process are fused using an iterative algorithm which pairs common sets of triangle vertices in the mesh. For some operations a surface smoothing step might be necessary. If geometric analyses are to be performed, molds must be inverted to form a positive surface for comparison. Once aligned the geometry of the figurine labeled as target is analyzed for goodness of fit with the mold labeled source. If two similar positives (figurines) are to be compared initial determination of matching control points is accomplished manually then in a second step the two objects are aligned as described above. The comparative analysis to calculate mesh deviation is mathematically similar to the alignment and fusion algorithms.
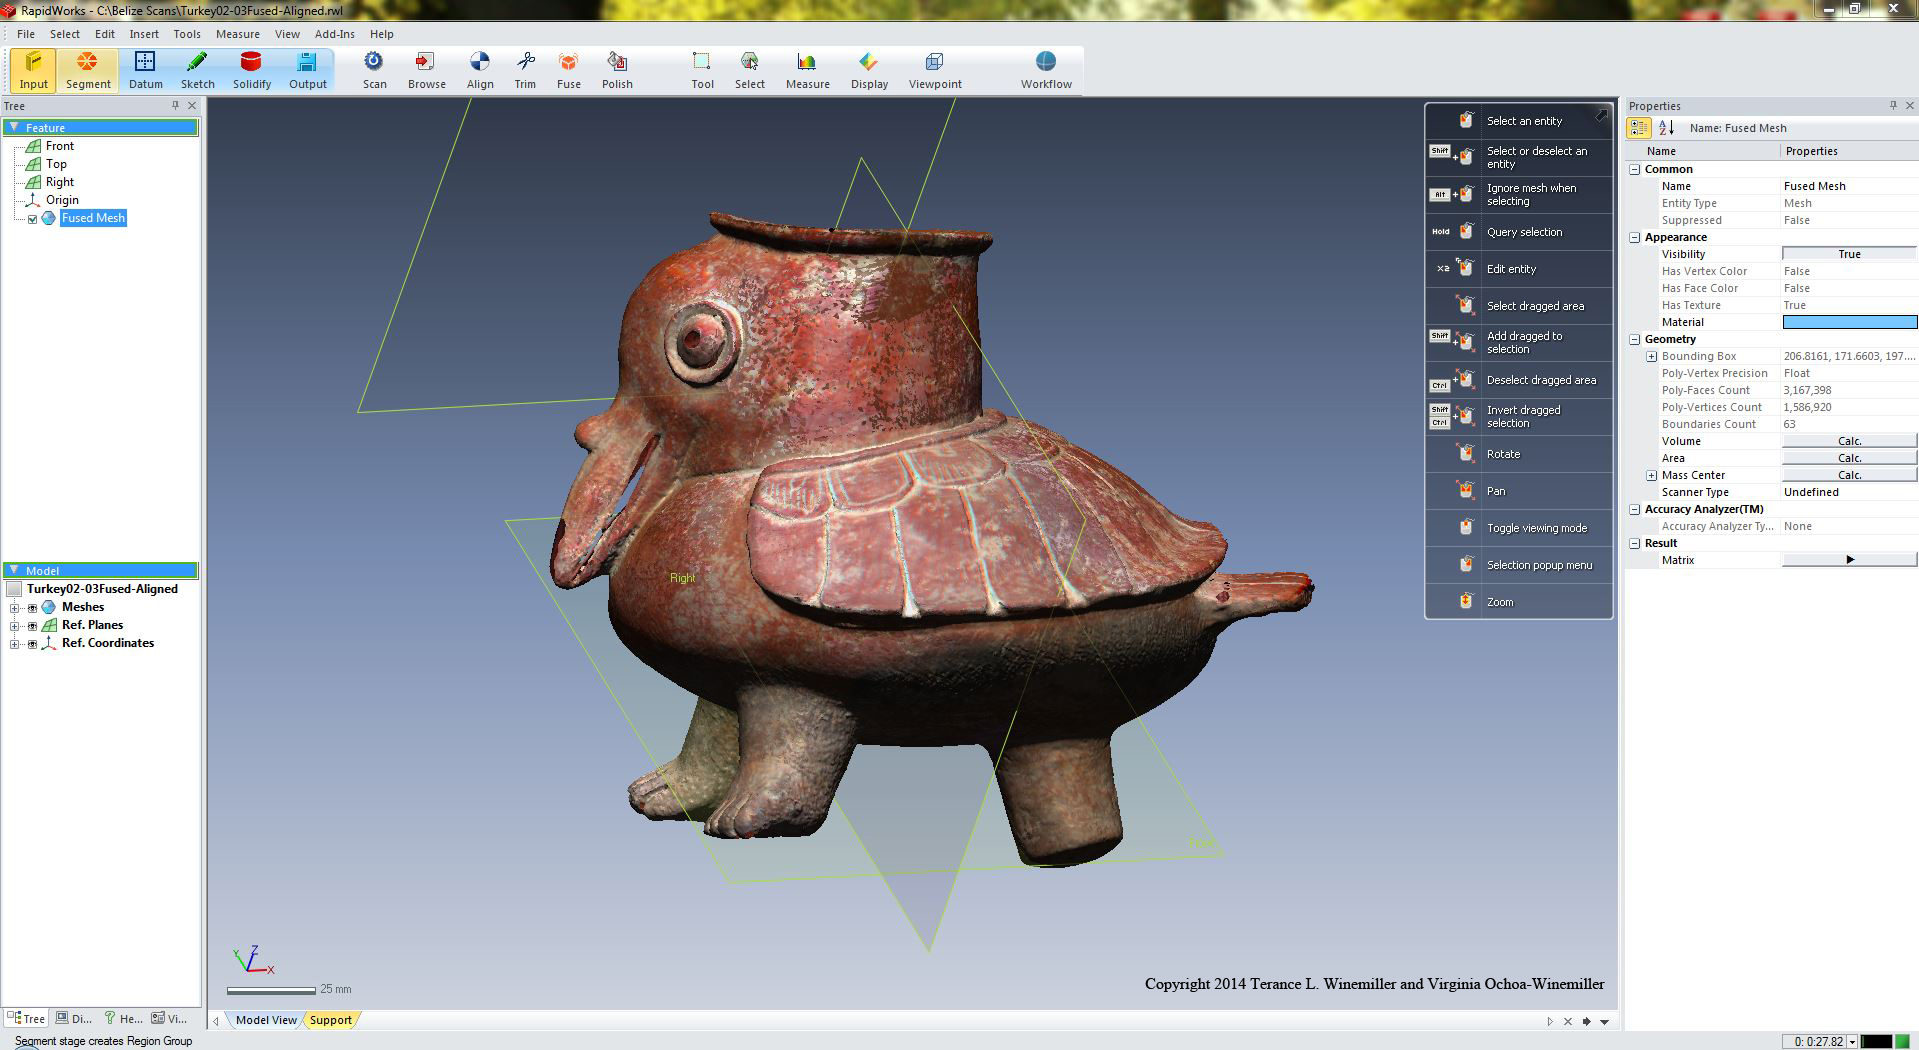
Bird Vessel Santa Rita Corozal. Full Size Image
Descriptions and detailed reports are provided as Adobe Acrobat files.
Atlas of Mesoamerican Sites | Summer 2008 in Honduras | Register
| Academics | Future
Students | Students | At
AUM | Faculty & Staff | Administration | Athletics Alumni | Student Services | E-Mail | Library | Blackboard | Webster | Request Information | Web Comments | AUM Home |
| Copyright © 2005 Auburn University Montgomery P.O. Box 2444023 | Montgomery, AL 36124-4023 | (334) 244-3000 |
| Please send email comments and suggestions to twinemi1@aum.edu |